Real-time monitoring of ML models
None of a financial company's ML models in production were monitored, and problems only surfaced after they hit the business. I facilitated the Design Sprint that defined PSI, KS and VDI dashboards with real-time alerts.
Project context
A Design Sprint run to develop a monitoring system for machine learning models and variable books in the GCP environment.
Without a monitoring system, it was hard to proactively spot model performance degradation, which undermined the quality of business decisions.
UX Designer on the Machine Learning team. I facilitated the Design Sprint, from stakeholder mapping to dashboard prototypes validated with data scientists and managers.
“Only finds model problems after they impact business results, because there's no way to automatically monitor performance degradation or data drift.”
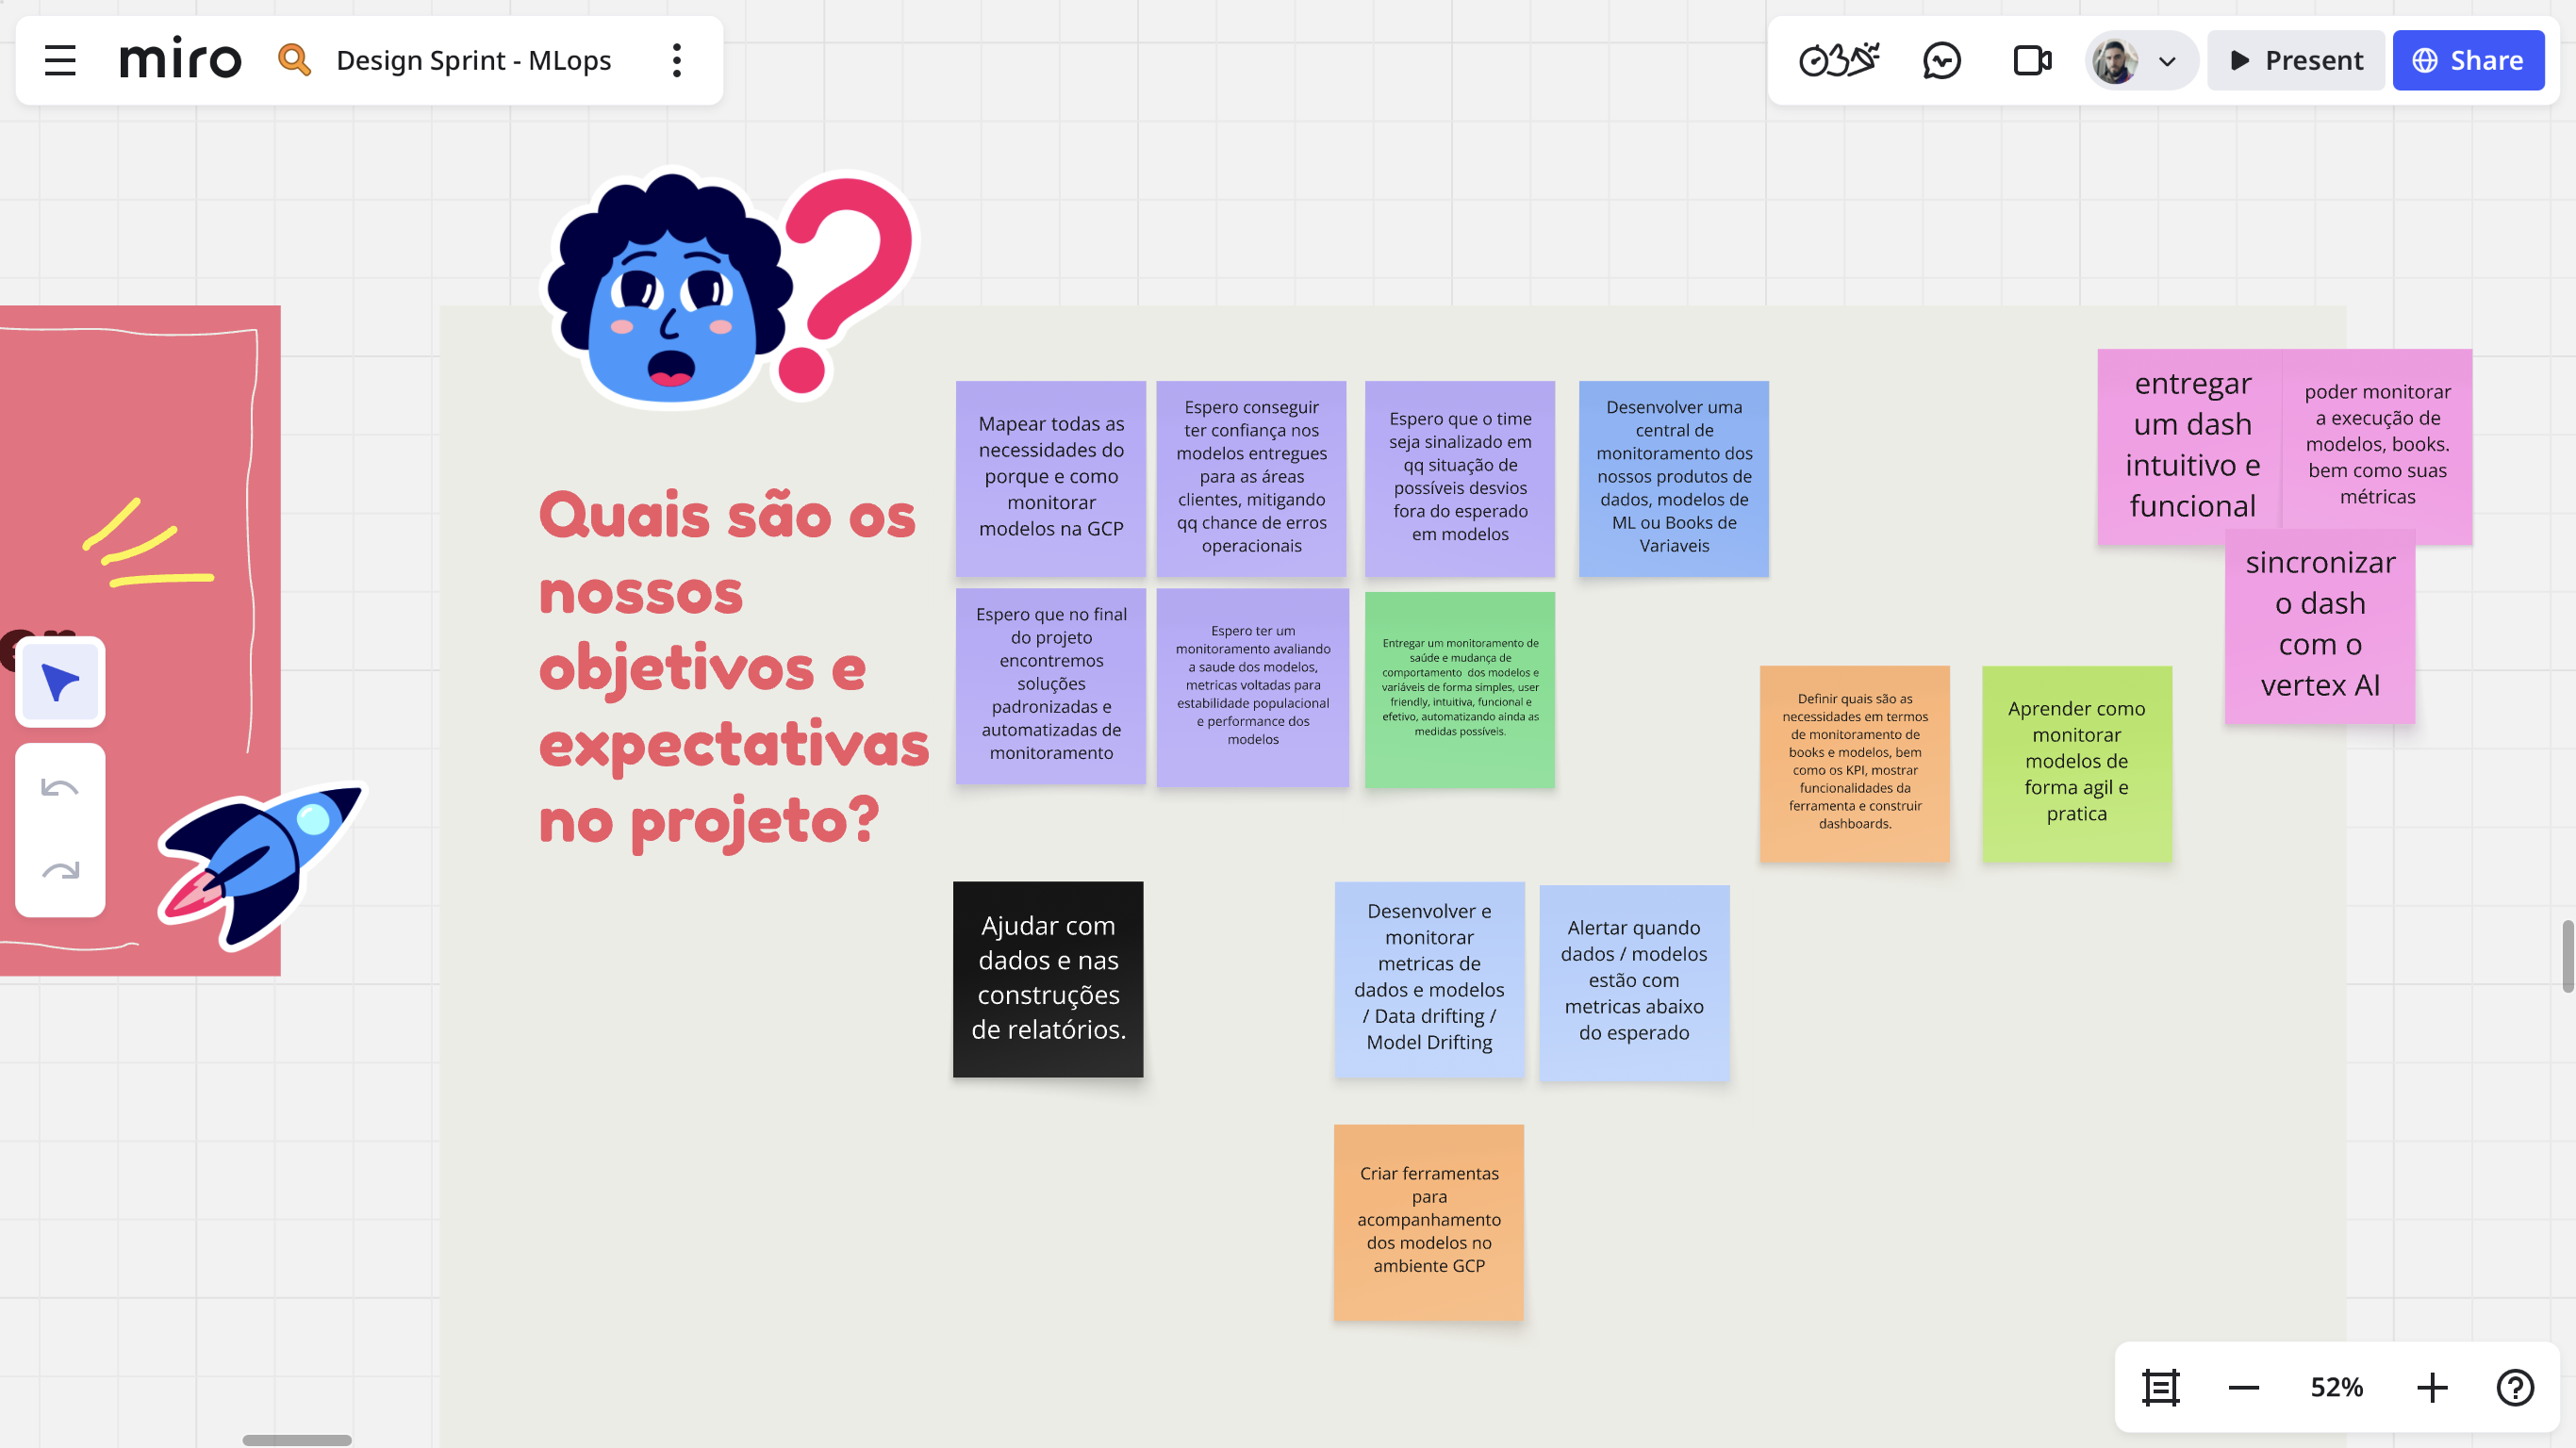
“A centralized system that monitors every model automatically, flagging drift in real time for preventive action before the business is affected.”
What the data and users revealed
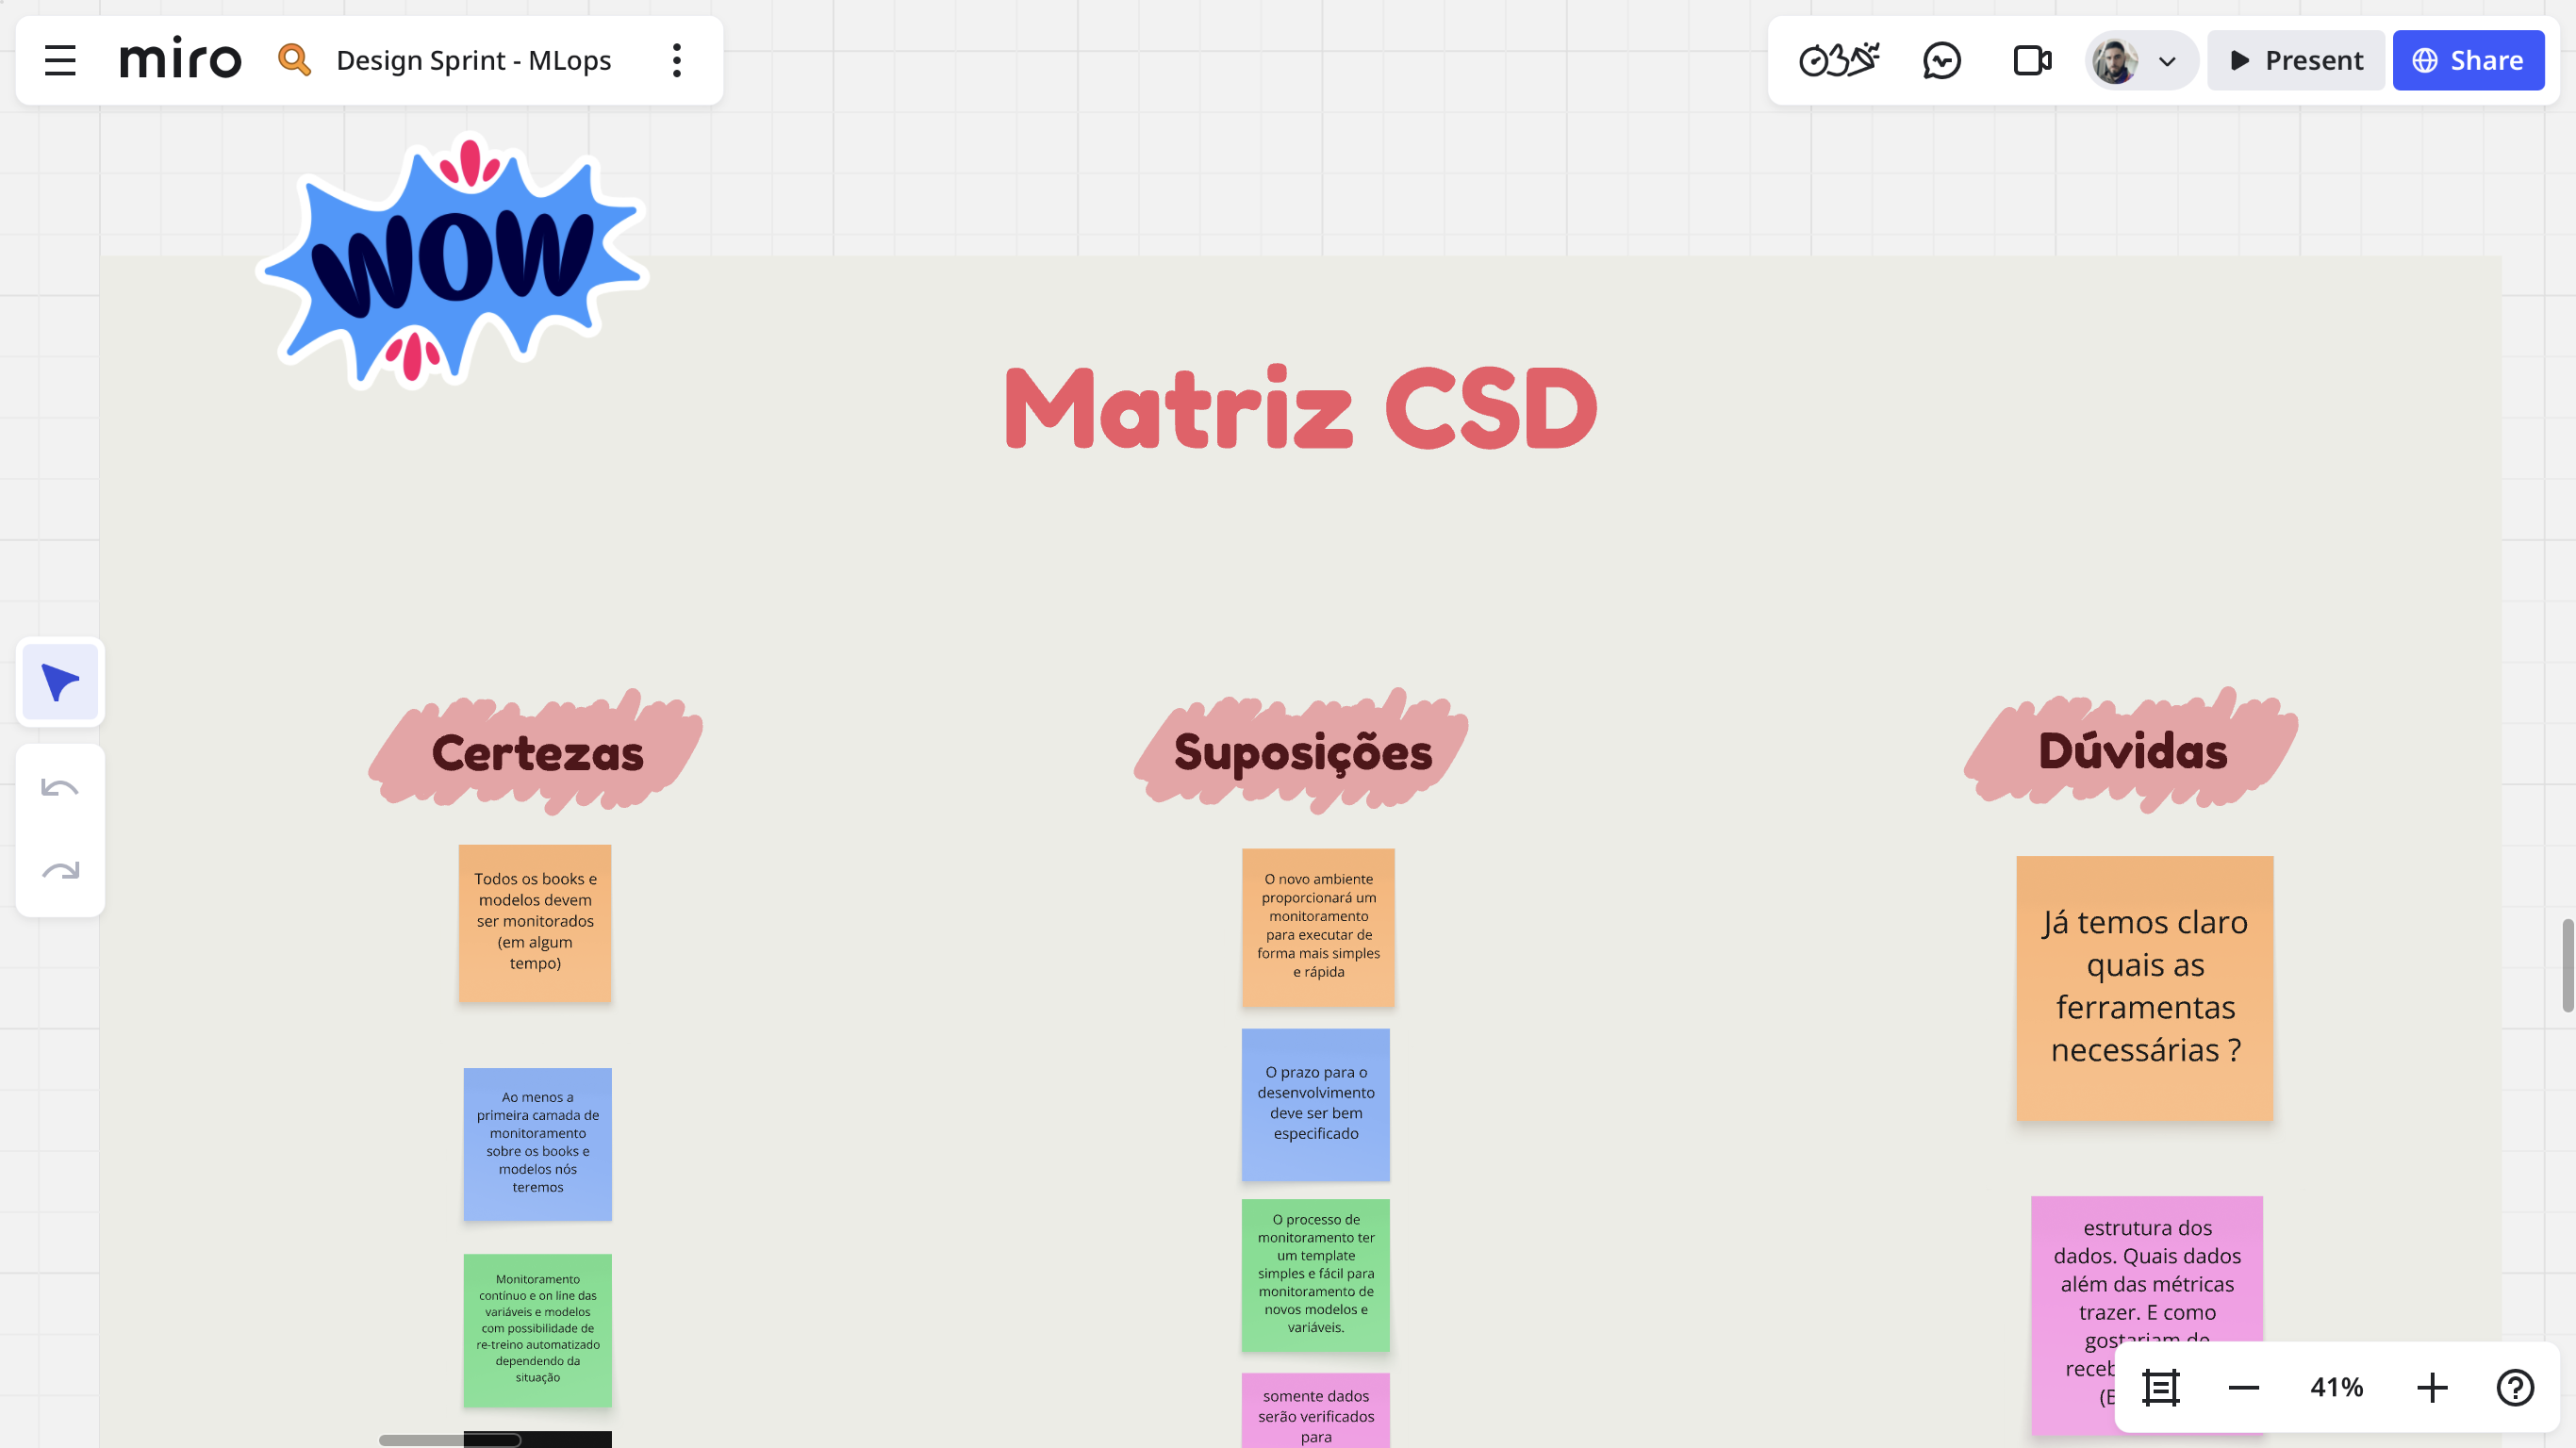
The CSD matrix showed that no model in production had automated monitoring: problems were only discovered after they hit business results.
Stakeholder mapping revealed distinct needs: scientists needed granular metrics (PSI, KS, VDI) and managers needed a consolidated executive view.
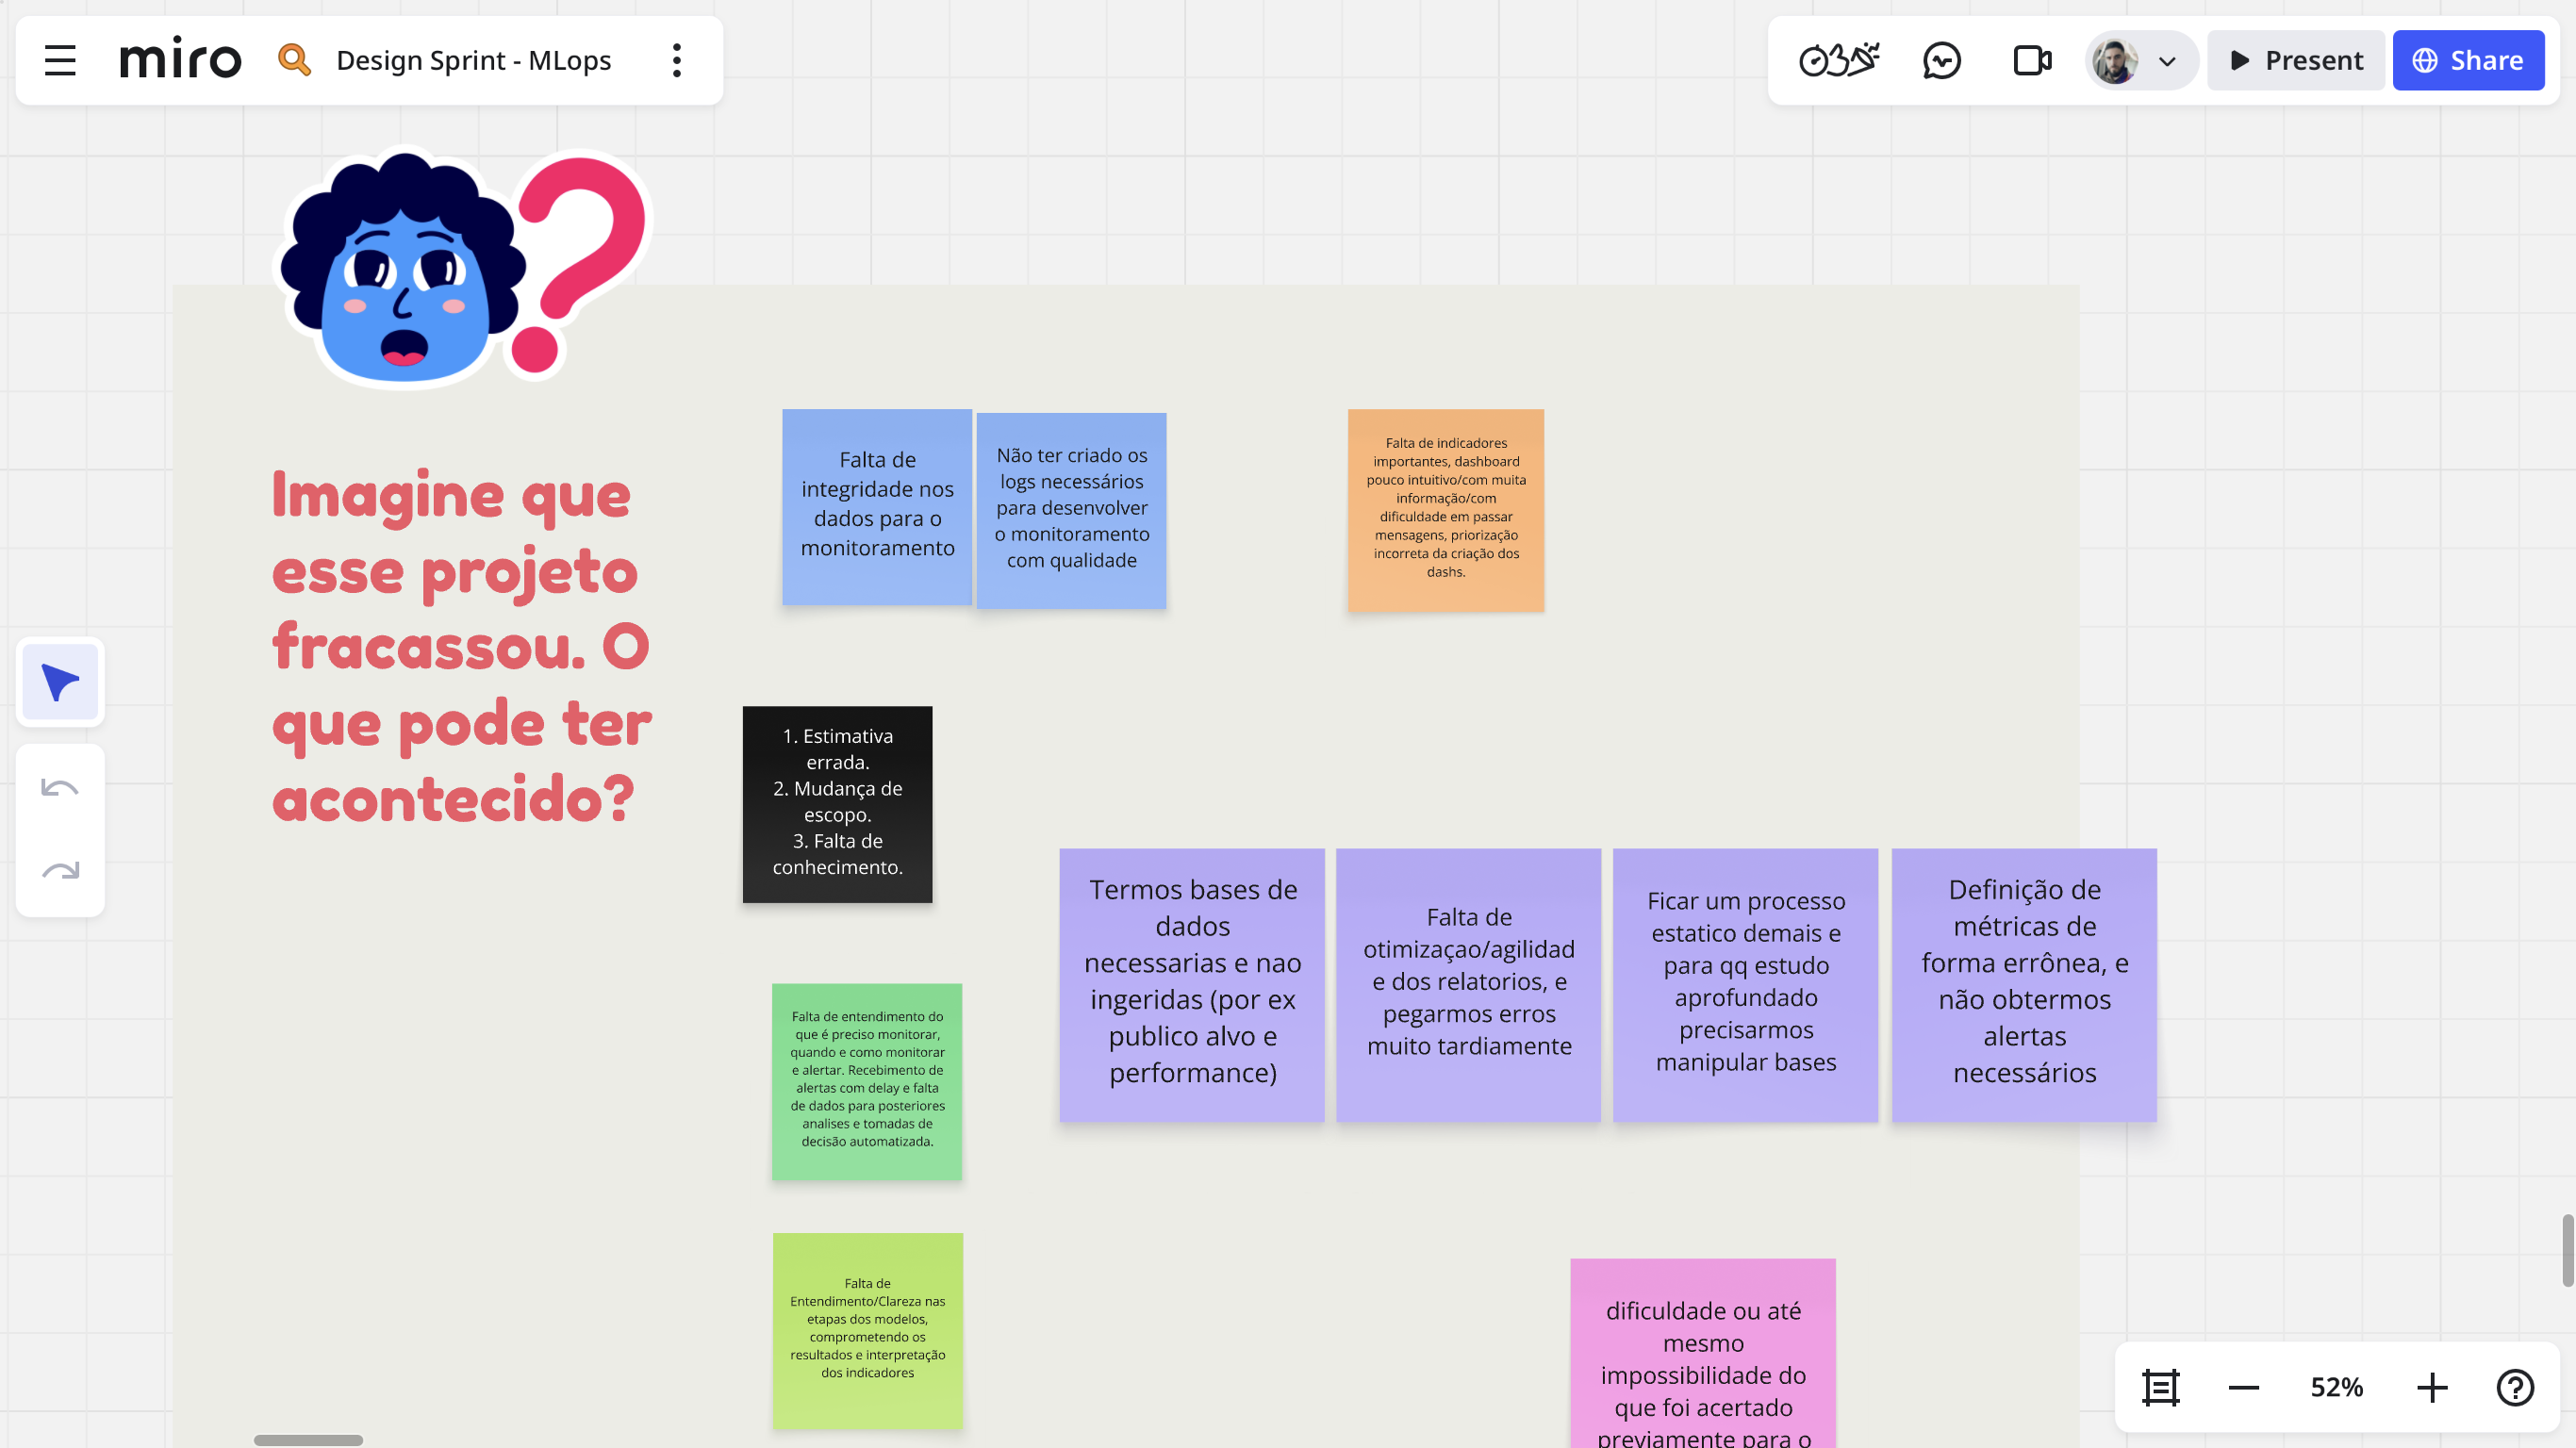
Teams struggled to define the right moment to retrain, with no comparative history or automatic drift alerts.
Without per-model cost control in GCP, it was impossible to optimize AI infrastructure spend and justify budgets.
From problem to solution
CSD matrix and stakeholder mapping
We built a CSD matrix to map certainties, suppositions and doubts about the requirements, and mapped stakeholders from the strategic to the operational level.
Proposed solutions and monitoring framework
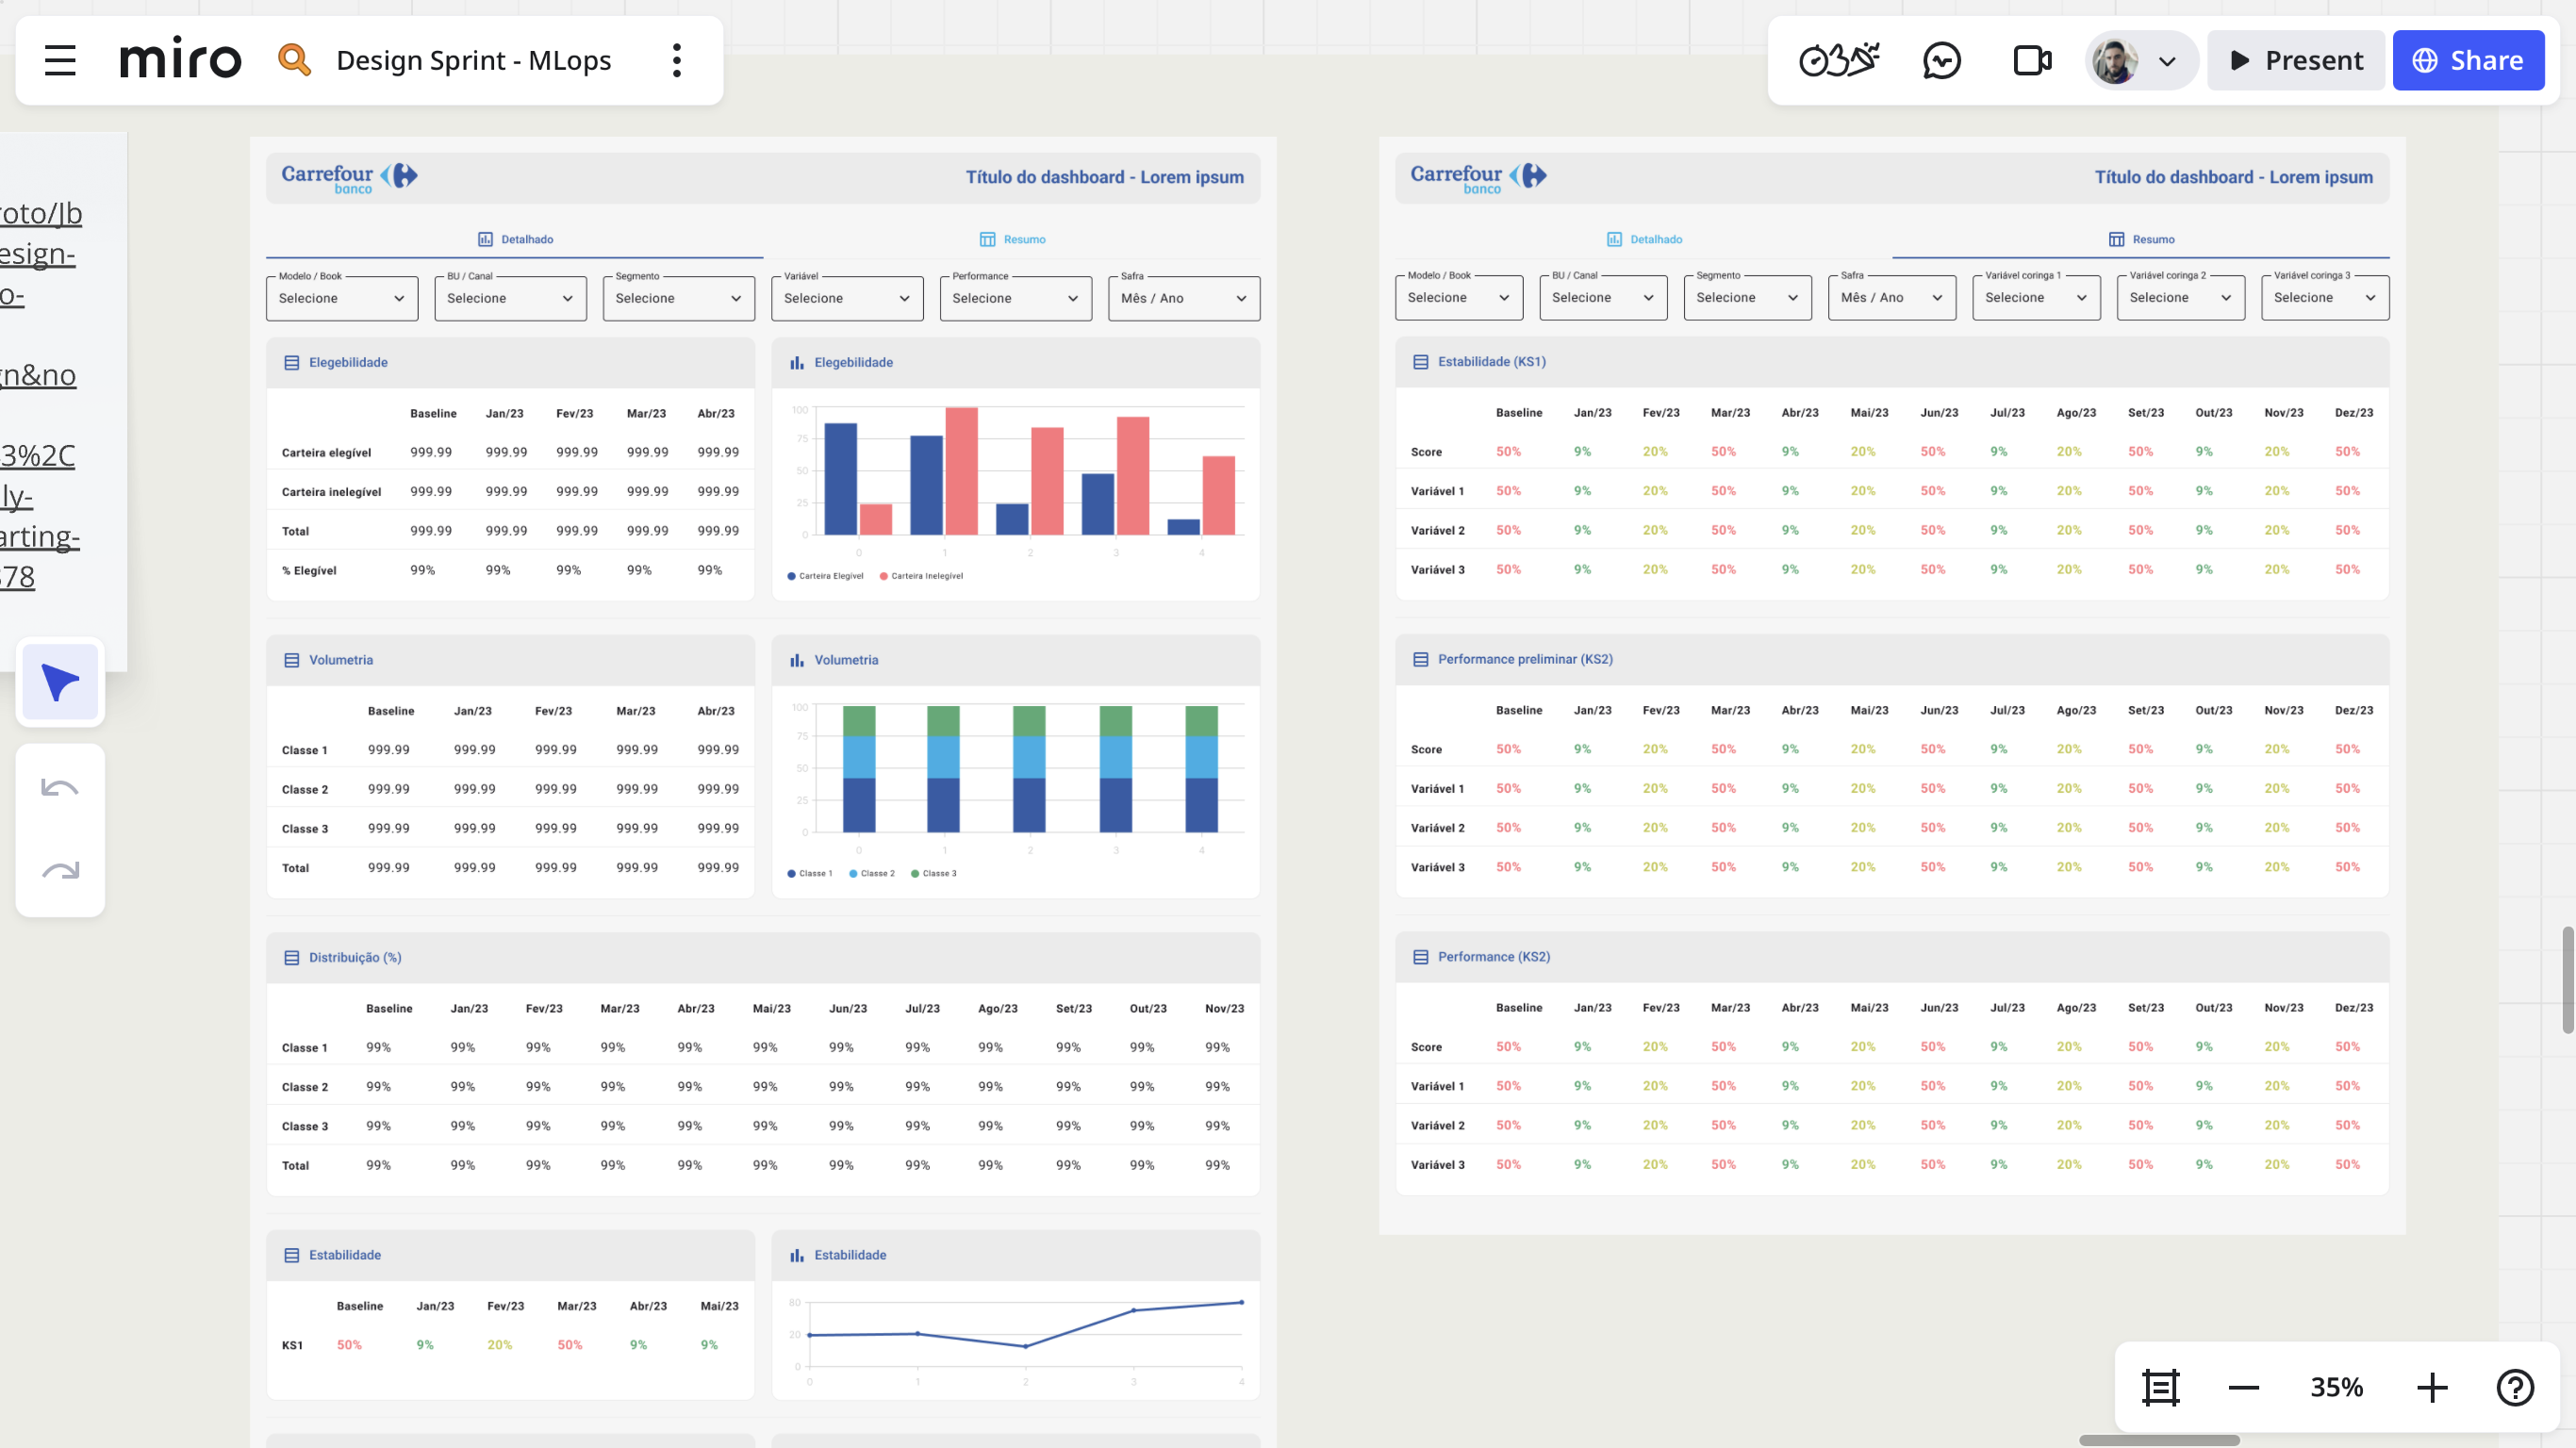
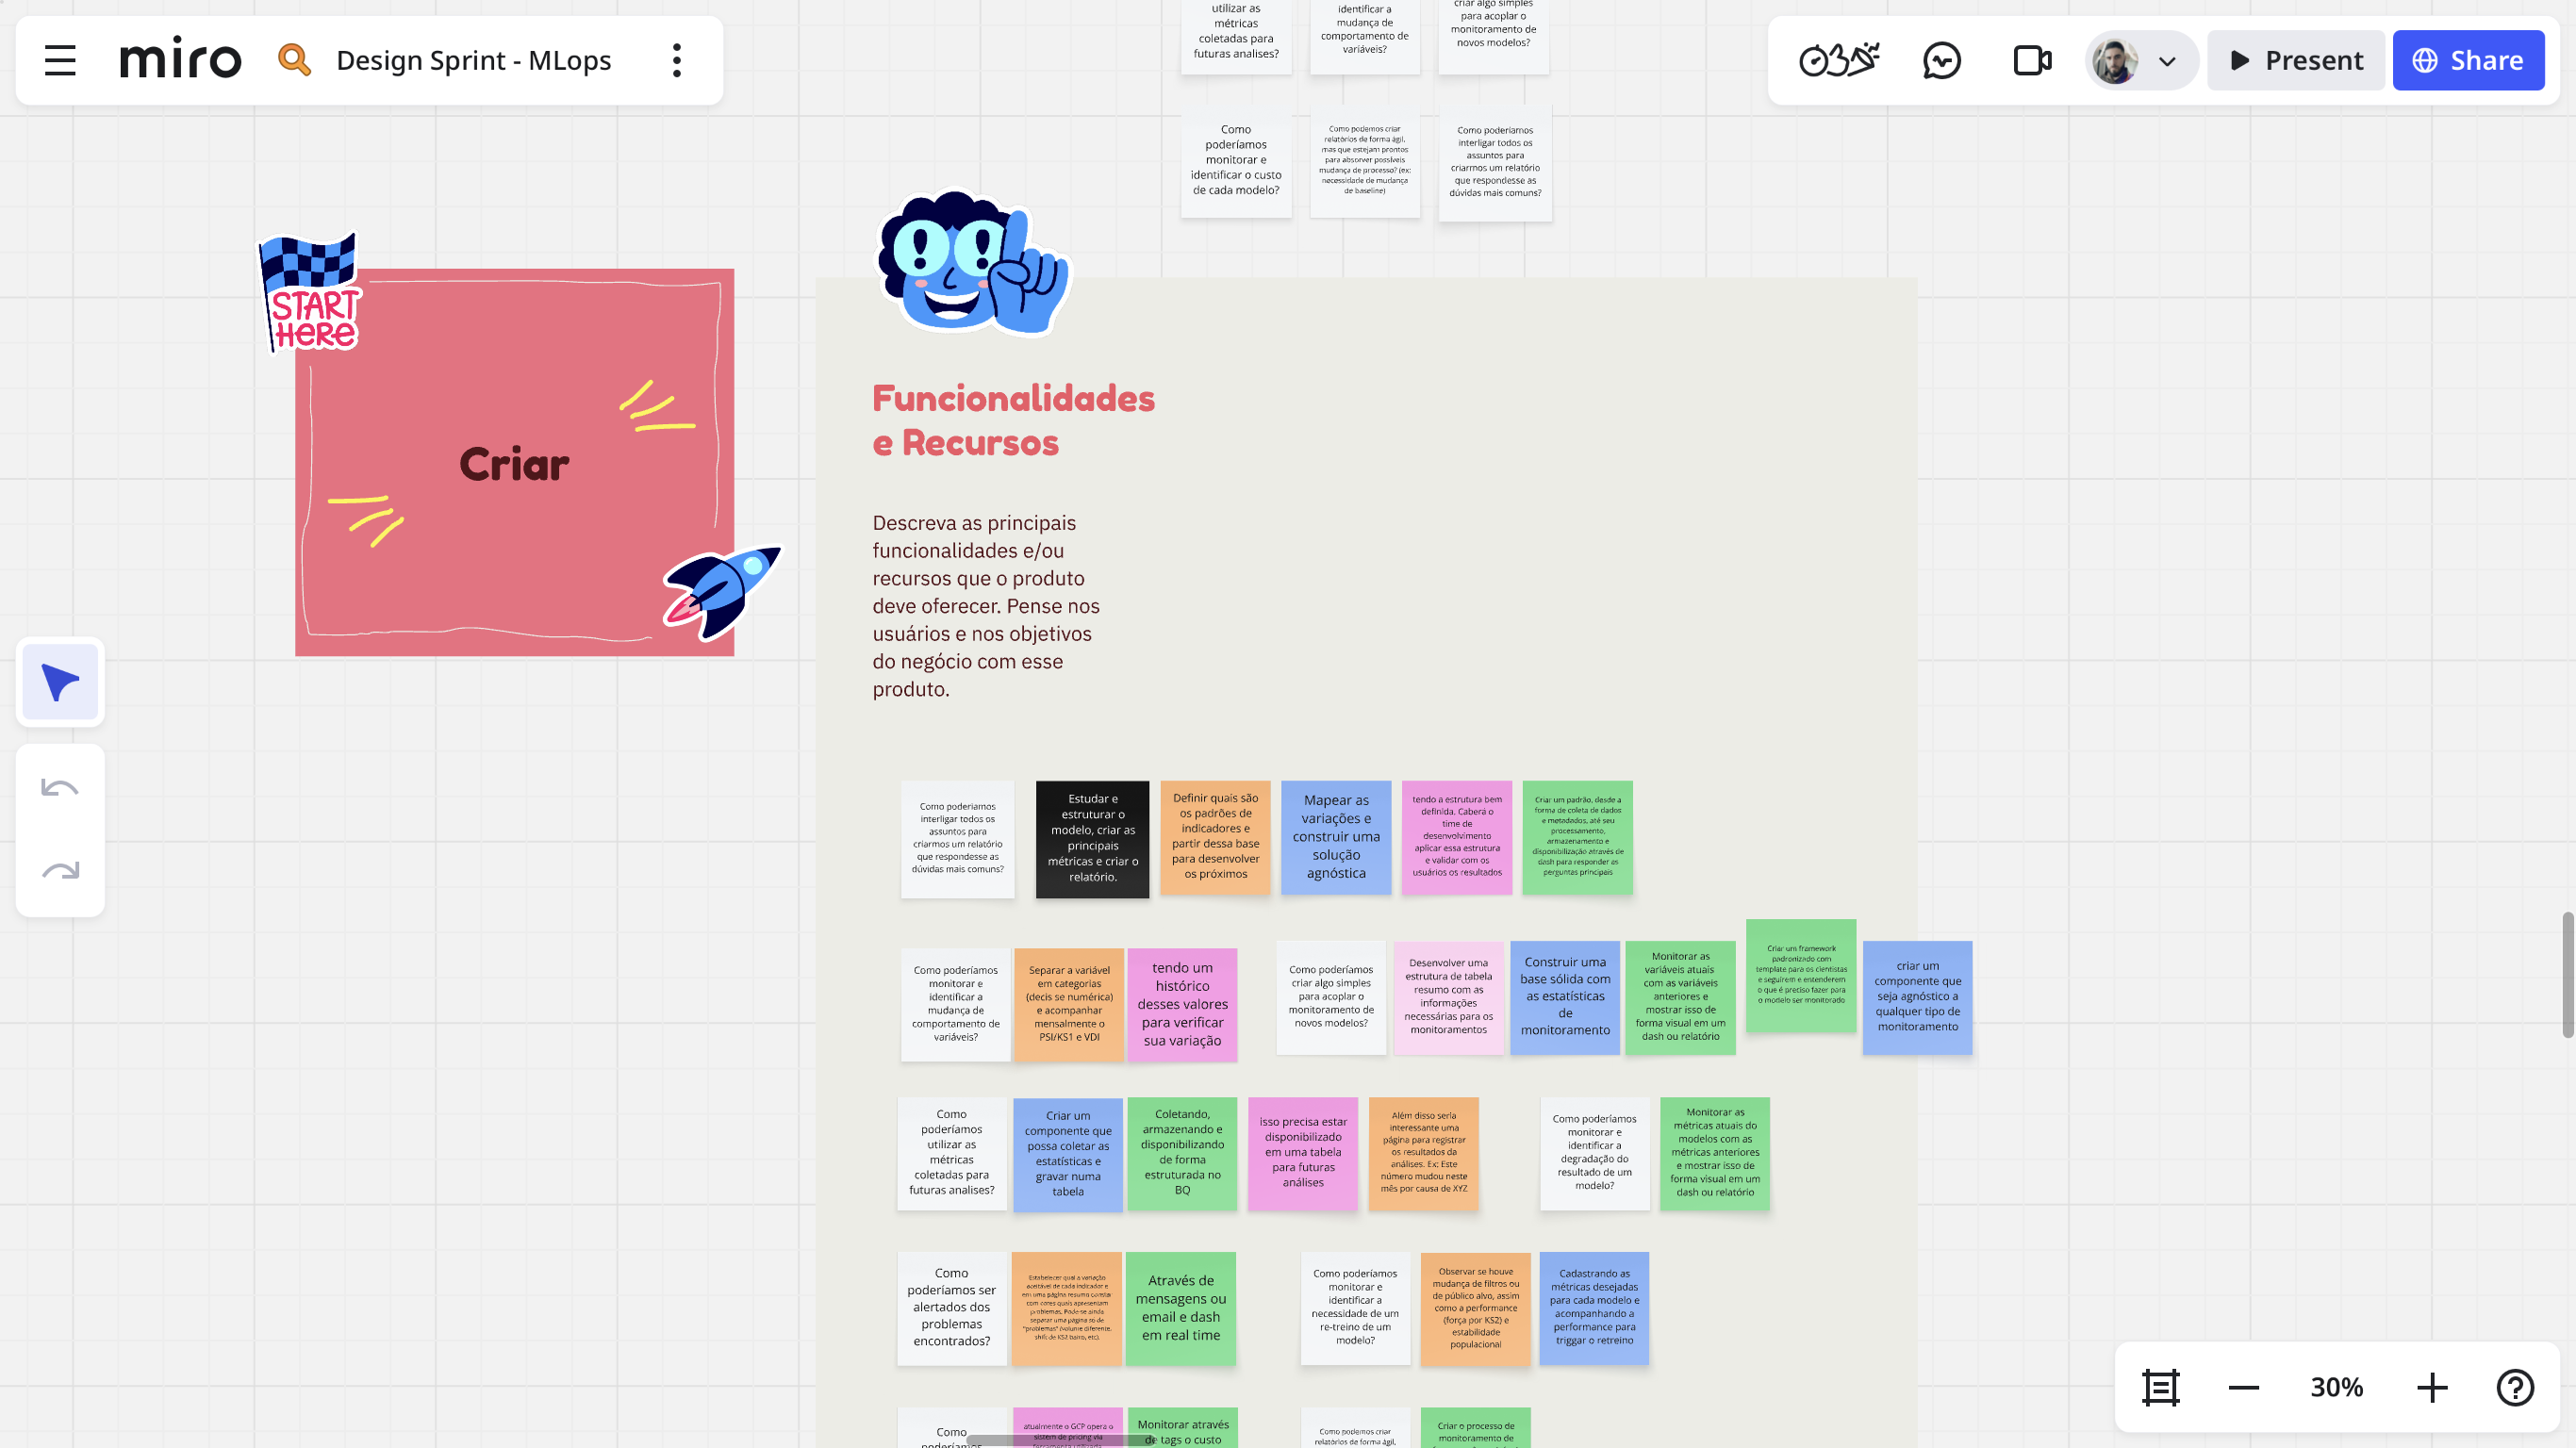
We proposed solutions such as categorizing variables, monitoring PSI, KS and VDI monthly and running historical comparisons.
Scope definition and system components
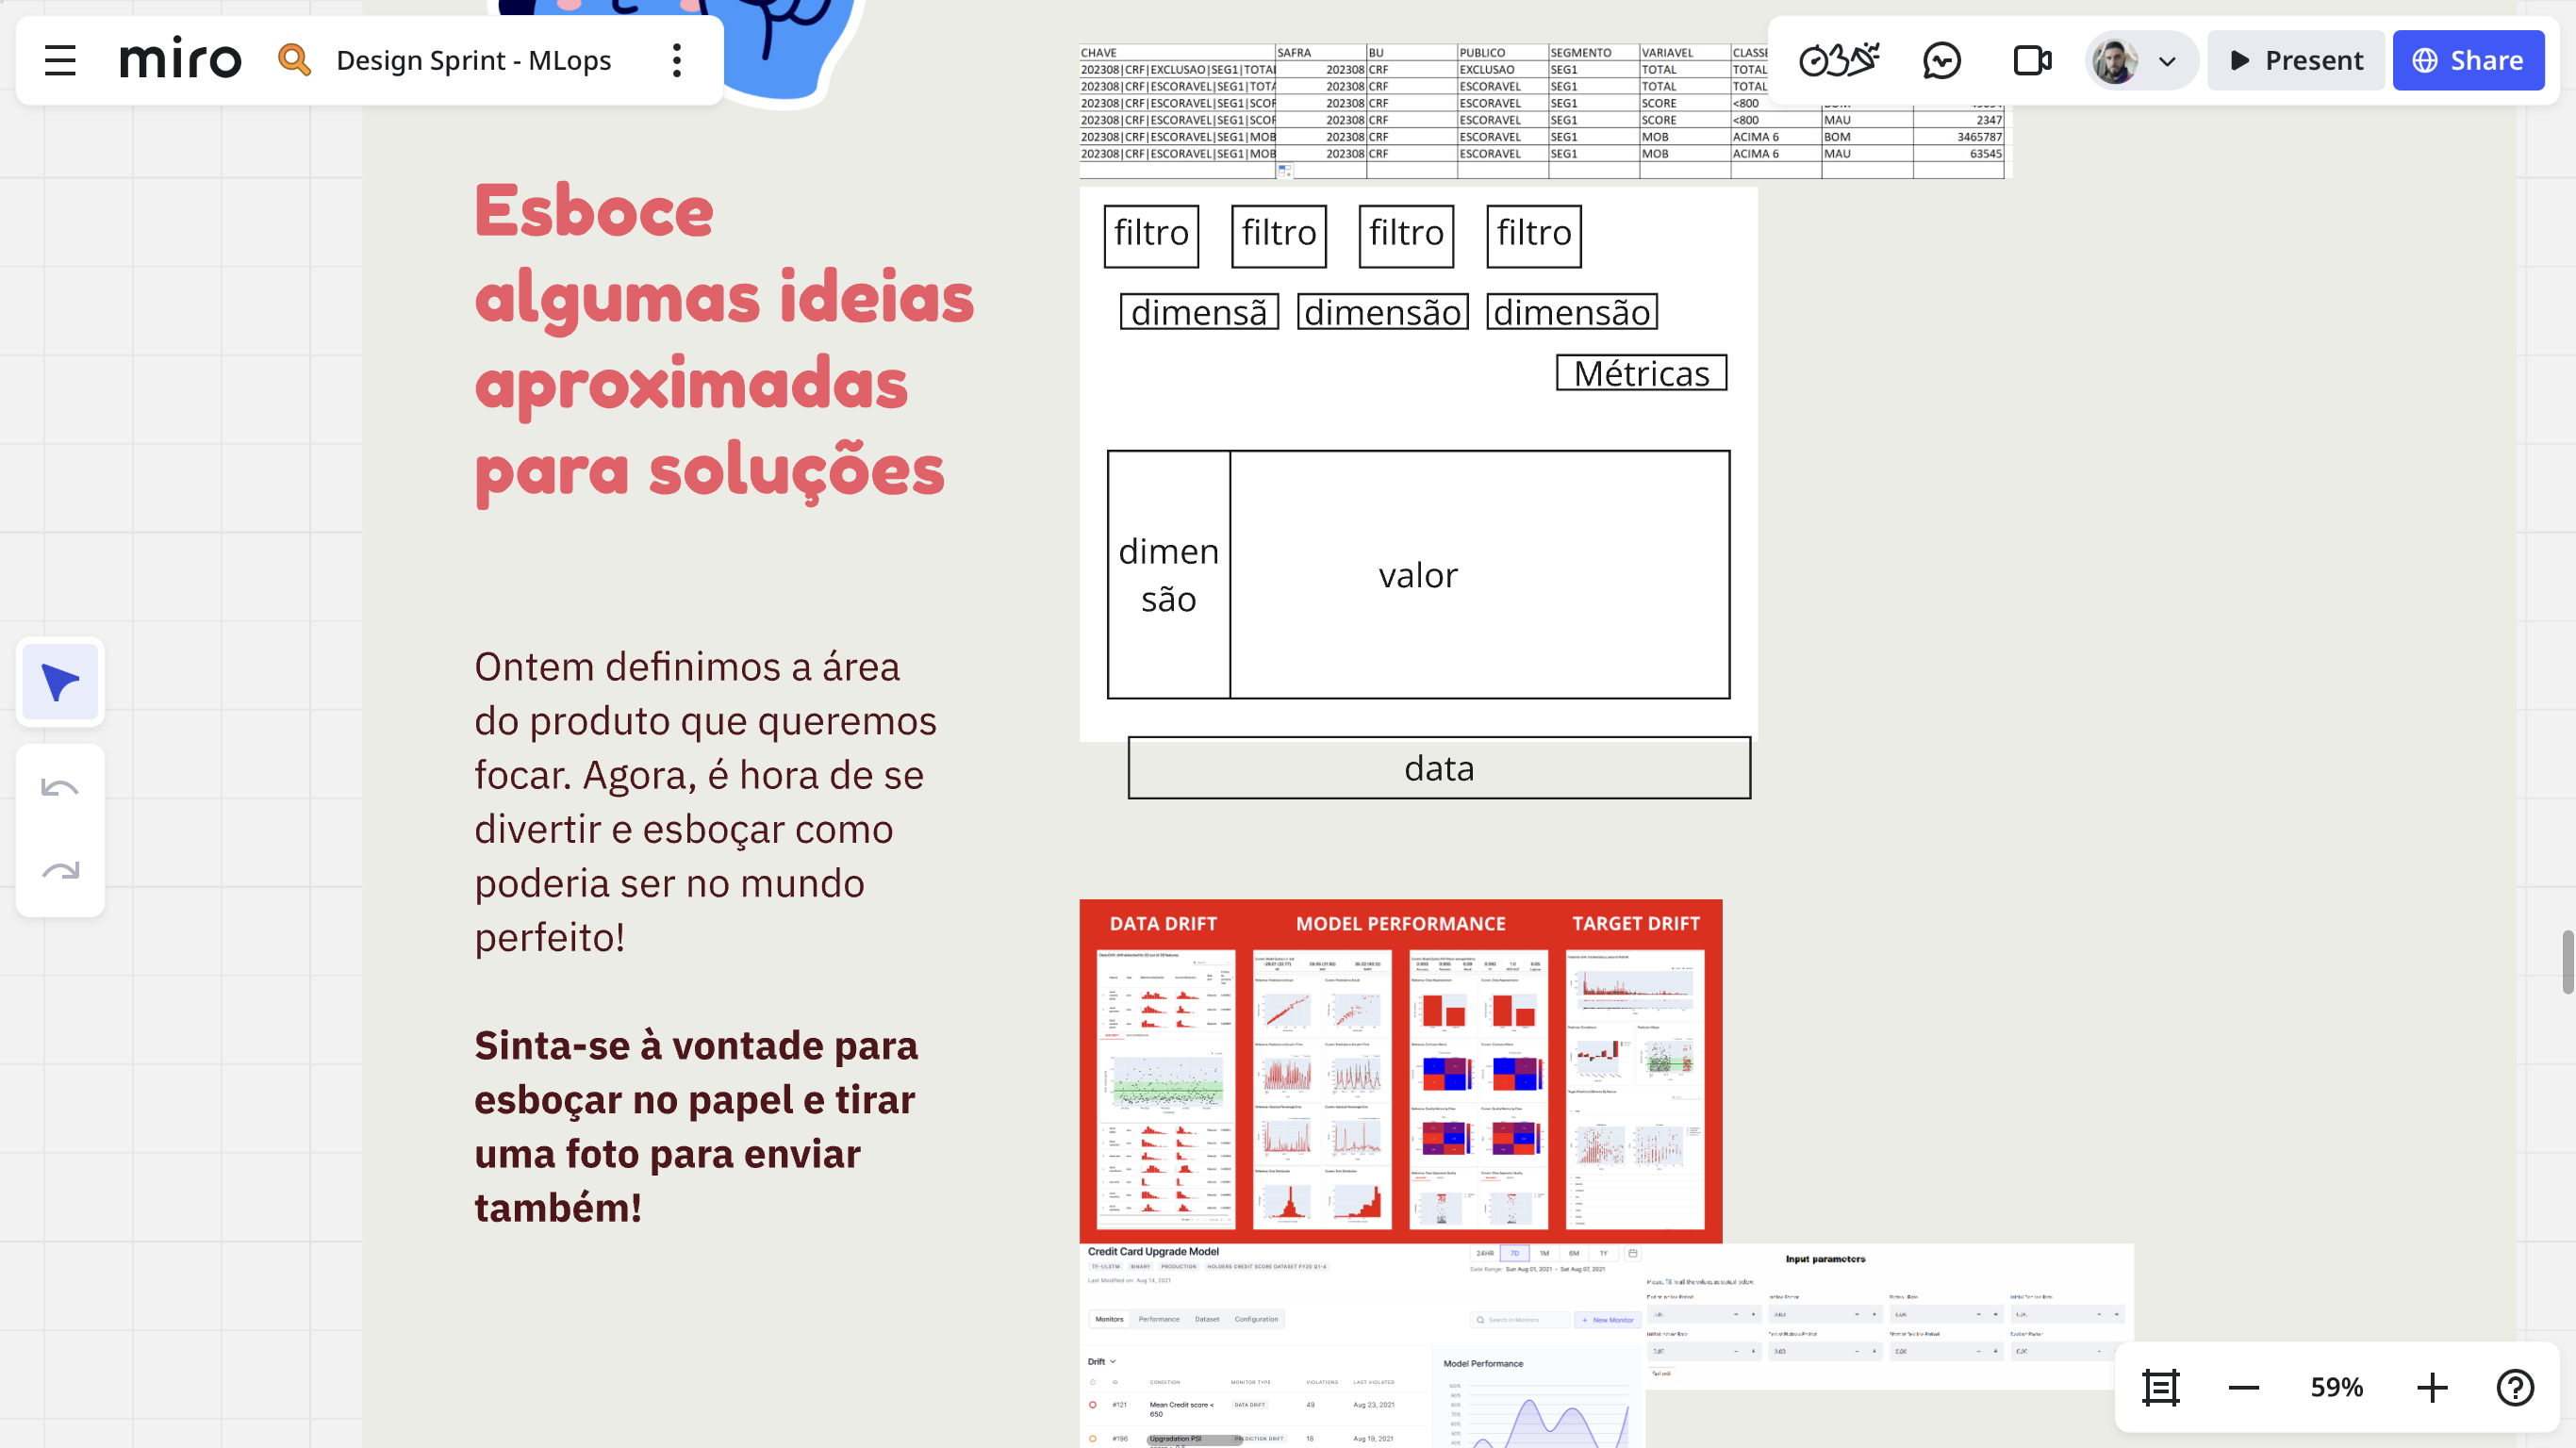
The scope was set as monitoring every model, with specific books when needed. We detailed the components: dates, values, dimensions and filters.
Lo-fi prototypes, dashboards and stakeholder validation
I created low-fidelity interfaces with sample dashboards, variable visualization, model degradation and an alert system, validated with stakeholders.
A visual walkthrough of the solution
Why each choice matters
Centralized dashboards with critical metrics
PSI, KS and VDI were centralized in dashboards with color-coded indicators, to quickly assess each model's health.
GCP architecture with Vertex AI and BigQuery
The architecture combines Vertex AI and other GCP components, with metrics stored in BigQuery for historical analysis and cost control.
Automated alerts and preventive action
Alerts via message, email and real-time dashboards ensure problems are caught before they affect the business.